
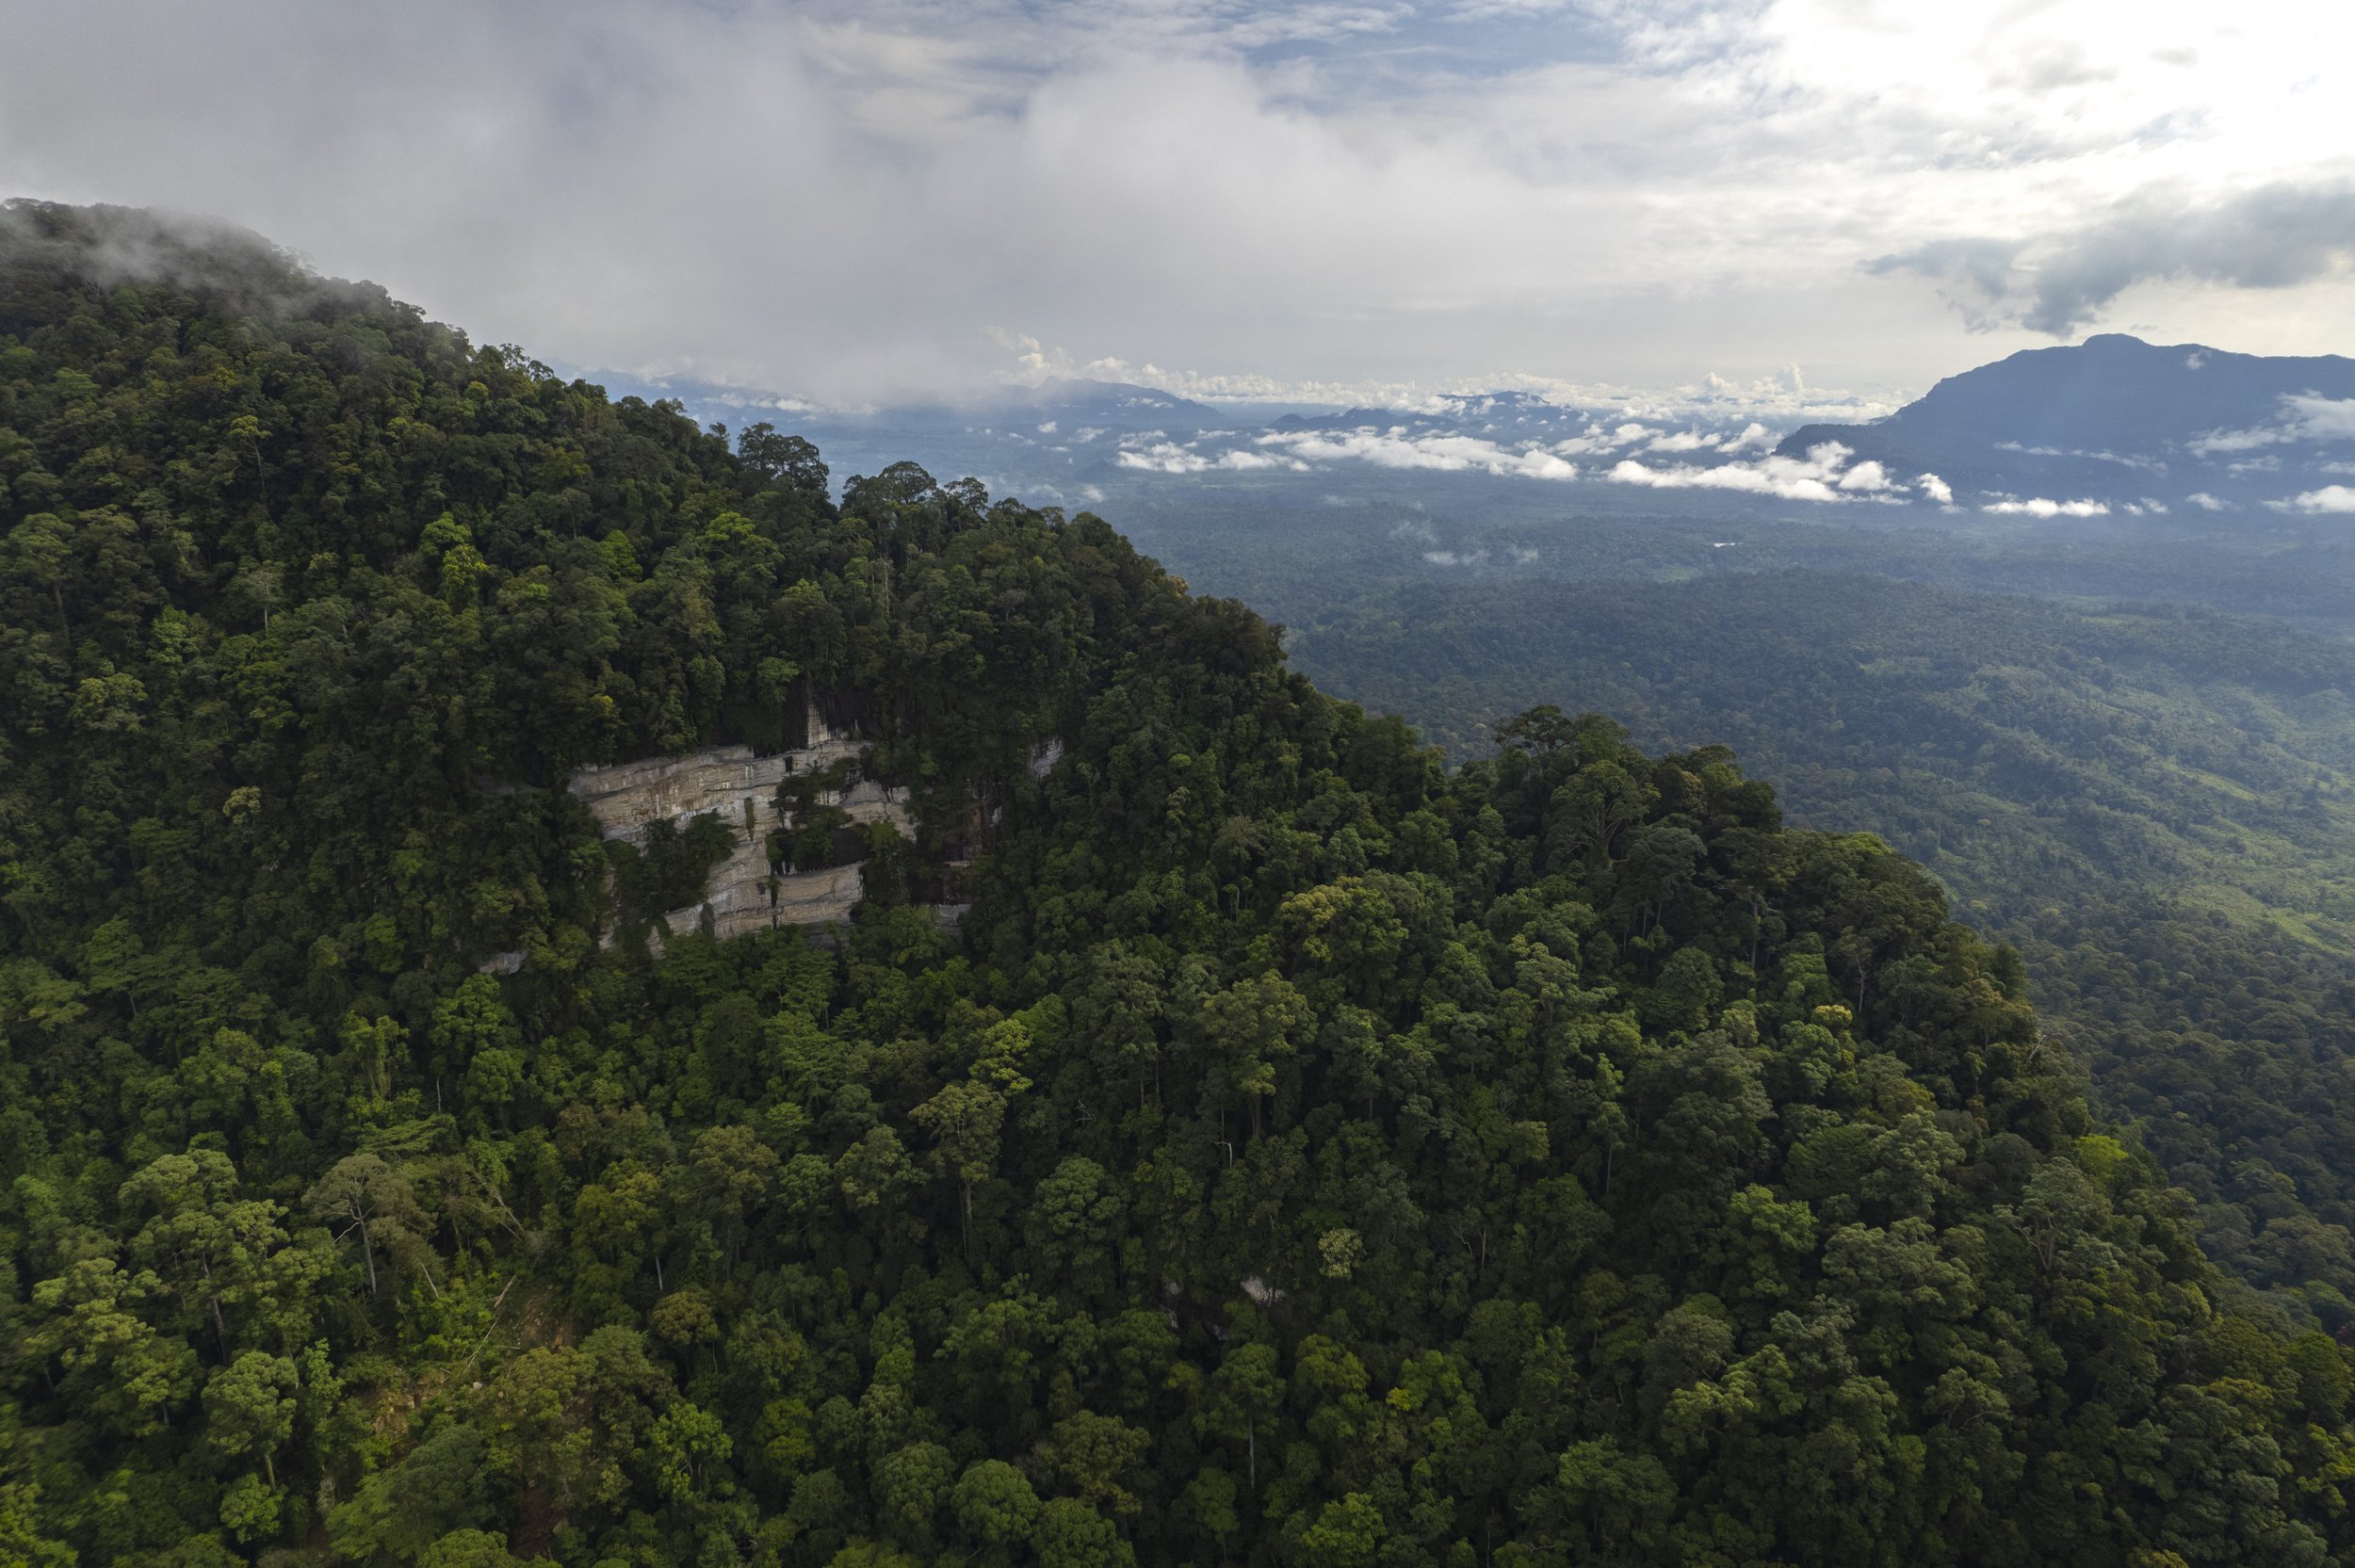
Forest and ecosystem health
Large-scale deforestation primarily for palm oil plantations, fires in peatlands and forests, and illegal logging makes Indonesia one of the world's largest greenhouse gas emitters. According to Global Forest Watch data, Indonesia lost approximately 30.8 million hectares of tree cover between 2001 and 2023. (That’s 62 million US football fields).
Indonesia’s most marginalized citizens and ecosystems are casualties of widespread impacts. Exacerbating natural disasters such as floods, droughts, and sea level rise, jeopardize the livelihoods of millions dependent on agriculture, fisheries, and coastal resources. The crisis is urgent.
enhancing forest cover and ecosystem resilience
While the situation seems dire, we have reason to hope.
Indonesia is at the center of the interconnectedness of Indigenous rights, biodiversity loss, and climate change. When solutions arise that address all three, they can be catalytic of powerful transformations.
Our previous satellite analysis, reports from the ground and carbon sequestration analysis showed us that in areas where we partnered with communities, deforestation was decreasing. Gunung Nyiut, the landscape where we first started supporting communities and a prime target for illegal enterprises, became a carbon sink in 2015.
Encouraged by this we wanted to dive deeper into the data. This year, Planet Indonesia has partnered with Maya-climate to use cutting-edge AI tools to measure the impact of our interventions with communities on the integrity of the forest and surrounding ecosystems using 14 different datasets. This collaboration produced an exciting, new impact report that compares forest health in sites before and after we partnered with a village, and between control and treatment areas.
The data reveals a clear positive impact of the intervention on forest ecosystems in the treatment sites compared to the control. Forest regeneration rates in treatment sites were significantly higher, while deforestation rates and fire occurrences were lower. Post-intervention, treatment sites experienced greater forest cover stabilization, reduced fire frequency, and healthier vegetation. These outcomes underscore the effectiveness of the project in enhancing forest cover and ecosystem resilience, particularly in treatment areas where intervention strategies were applied. The comparison with the control site further highlights the success of the project in mitigating deforestation and promoting ecological recovery.
We analysed,
Tree cover loSS

Forest cover change provides insights into deforestation trends from 2000 - 2023 (fig 1).
Across all sites from 2000 - 2016, before communities began implementing the Planet Indonesia model, deforestation rates were steadily rising, peaking at 2.33% in 2016. This reflects a concerning growth in deforestation activities, from illegal logging, mining or selling off/losing land to plantations.
However, in the intervention sites over the years 2017-2023, this trend was reversed with a notable decline in the deforestation rates, peaking at 1.54% in 2017 and gradually reducing thereafter. Deforestation is decreasing up to 7 times faster in treatment sites (2-7x across sites). This shift indicates a positive impact of the intervention measures, illustrating an approximate 33.9% reduction in the peak deforestation rate from 2016 to 2017, and a continued downward trend in the following years.
We are moving to keeping crucial carbon-rich, primary forest standing.
Fig 1. Average Annual Percent Change in Tree Cover Loss between Control and Treatment sites from 2000-2023. Before is the pre-project intervention (2000-2016) and After is the post-project intervention (2017-2023).
The dataset employs high-resolution Landsat imagery to track changes in forest cover globally. The spatial resolution of 30 meters ensures detailed observations of forest conditions over time.
Forest and Mangrove Regeneration

Not only is deforestation decreasing, but the trees are returning. Through analyzing land cover changes, we can take a closer look at our work’s impact on forest and mangrove regeneration.
Over time from 2016-2023, in Kubu Raya, tree cover increased slightly from 97.67% to 98.82%, indicating a stable and successful intervention. Gunung Nyiut showed more fluctuation, with tree cover rising from 73.26% to 99.48%, resulting in a 19.02% increase overall. Gunung Naning experienced the most significant change, with tree cover increasing by 34.98% from 57.95% to 99.78%, particularly after interventions in 2020. However, we recognize that there is a high amount of missing data from Gunung Naning which may impact the accuracy of the analysis. But the overall trend from all three sites is positive and clear, tree cover is increasing.
When we compare the sites of our intervention with control sites (fig 2), Gunung Nyiut, where we have been working with communities the longest shows significantly higher forest regeneration (3.72 times) compared to the control. While there was some deforestation across both sites, the rates of regeneration were higher where communities implemented the core model approach, putting the area in a net forest gain. Note this data set only includes data up to 2020, which is why no comparison can be made for Gunung Naning
.
Fig 2. Regeneration rate per hectar representing the changes in Forest Cover, Control v Treatment.

“If you cut down a mangrove tree, you must replace it with ten seeds”
Fire Reduction

Burned area analysis shows a notable reduction in fire occurrences post-intervention. In Kubu Raya, fire frequency dropped by 75%, and Gunung Naning saw a near-complete reduction in fires post-2020. Gunung Nyiut, which previously had the highest frequency of fires, also experienced a marked decrease, indicating successful fire prevention measures after the intervention. While weather conditions have been unpredictable and extremely wet these last few years, which may impact the use of fire for farming, through our fire free village programs farmers have self reported the reduced use of fire and increase in crop yield using their new climate-smart agricultural techniques.
Fig 3. Average Percentage Burned Area for all treatment areas combined, before and after intervention.
Vegetation Cover
We analyzed land cover and the differences in sparse and dense vegetation across the terrestrial sites Gunung Nyiut Nature Reserve and the Gunung Naning Protection Forest. Both sites exhibit notable improvements in vegetation health and coverage from 2017-2023. The forest transforms as scattered trees and once cleared areas undergo natural and planned reforestation efforts, and the rise in climate-smart agriculture.
In Gunung Nyiut, we see a clear reduction in sparse vegetation and an increase in dense vegetation post-2019, dense vegetation coverage increased to 82.6% by 2023. While, Gunung Naning saw similar improvements (fig 4.) with a significant enhancement in dense vegetation post-2017. Dense vegetation cover increased from 69.36% in 2016 to 80.2% by 2023, with sparse vegetation decreasing.
These changes underscore the effectiveness of targeted interventions in each site, potentially contributing to better ecosystem services and biodiversity conservation. The analysis indicates that strategic management and conservation initiatives have positively influenced vegetation dynamics in both areas.
Fig 4. Gunung Naning Shows Positive Trends in Vegetation Cover from 2017-2023 in this Normalized Difference Vegetation Index time series.

Map. The vegetation cover of Gunung Naning, July 2022.
-
This impact evaluation presents exciting findings from various datasets, all focused on assessing forest ecosystem health and the impact of community conservation on our climate. In this initial analysis, control sites were selected based on villages not yet partnering with us, which are currently located within the landscapes where we work. Therefore, the control-treatment comparison involves neighboring villages within the same landscape. We chose this approach to minimize differences in socio-economic conditions between control and treatment sites. However, it is noted that in some cases, there may be overlap in forest management areas, which could result in a 'spillover' effect from treatment areas to control areas. However, we wanted to take a conservative approach even if meant that we may be having an indirect positive impact on forest health in some control sites, and therefore are not true "controls."
Many villages we currently work with were not included as treatment sites due to limitations in available data as many forest datasets are only available up until 2020 or do not extend to 2024. Due to this, villages that partnered with us between 2016 and 2020 (and continue to partner with us till now) were included as 'treatment' sites, but those that have started working with PI 2021 onwards were not yet included as the "project period" data was too little to compare before-after / control-treatment. As more data is made available, we will include more sites in future impact evaluations.This analysis presents a fresh evaluation of our work, complementing other impact studies. Previous analyses, such as those from the Nusantara Atlas, have shown a 52.3% reduction in deforestation rates in treatment sites compared to controls, and a 91% reduction in primary forest loss in PI-affiliated communities with secured tenure—or that PI-affiliated sites had deforestation rates 17.9 times lower than control sites (Unpublished data, PI). text goes here
-
In the coming year, we plan to expand our use of the Maya-Climate platform for further impact evaluations, particularly by refining comparisons between control and treatment sites. We also plan to use the AI tool to bring data into community investments (e.g., direct grant-making to communities) and to support interested partners across Indonesia in using the tool to measure ecosystem health impacts.
Other exciting future directions will include biodiversity field surveys and data from patrols. These will provide further insights into the trajectory of landscapes and the overall health of ecosystems. For now, we are thrilled to share this impact report and welcome any questions from readers.